
Chart Tales: Data Visualisation & Storytelling Ideas
How Do You Turn Data into a Story?
· 3 min. · Sæson 2 Episode 2
Episodebeskrivelse
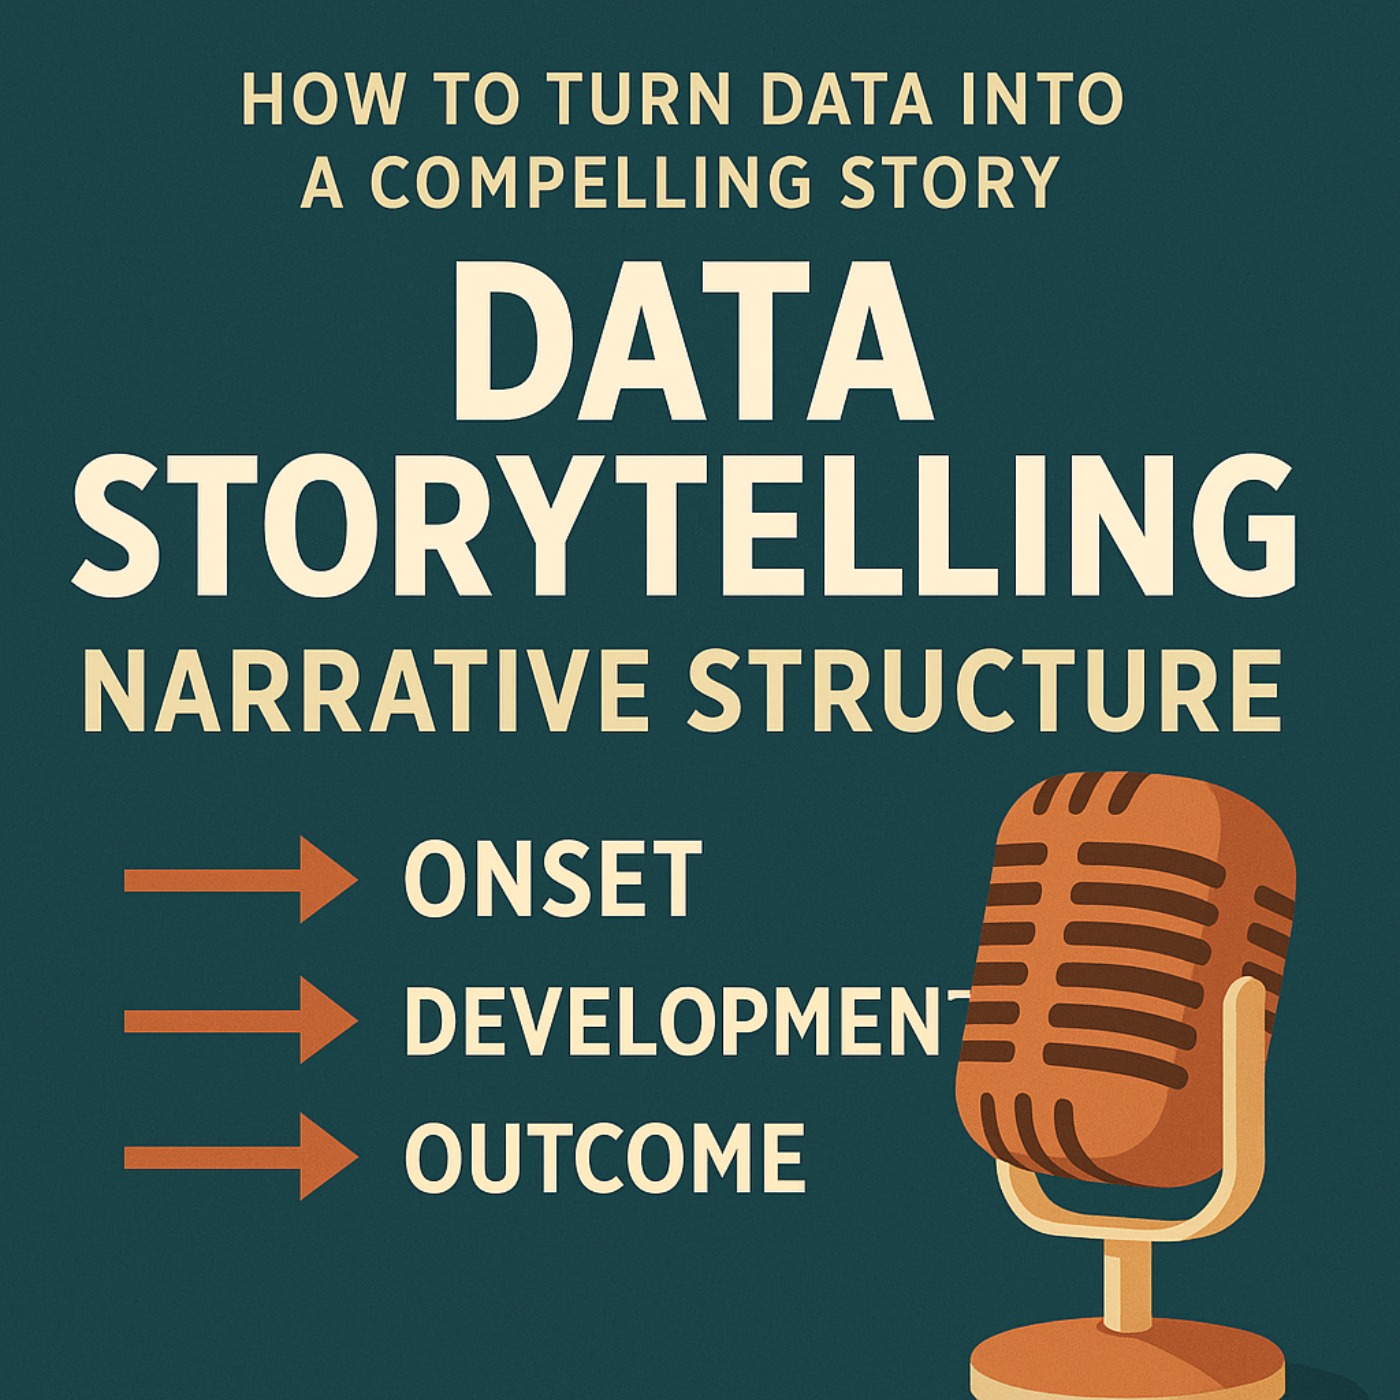
Learn how to turn data into a compelling story using the three-act narrative structure: Onset, Development, and Outcome. This data storytelling framework honed by Felipe Rego helps you set context, uncover insights, and drive decisions with clarity. Move beyond dashboards and reports to create engaging data-driven presentations that persuade, inspire action, and make your data visualization and communication truly memorable. Hosted on Acast. See acast.com/privacy for more information.
Website: feliperego.replit.app


