
Chart Tales: Data Visualisation & Storytelling Ideas
(Loosely) Defining Data Visualisation
· 3 λεπ. · Σεζόν 1 Επεισόδιο 9
Σημειώσεις επεισοδίου
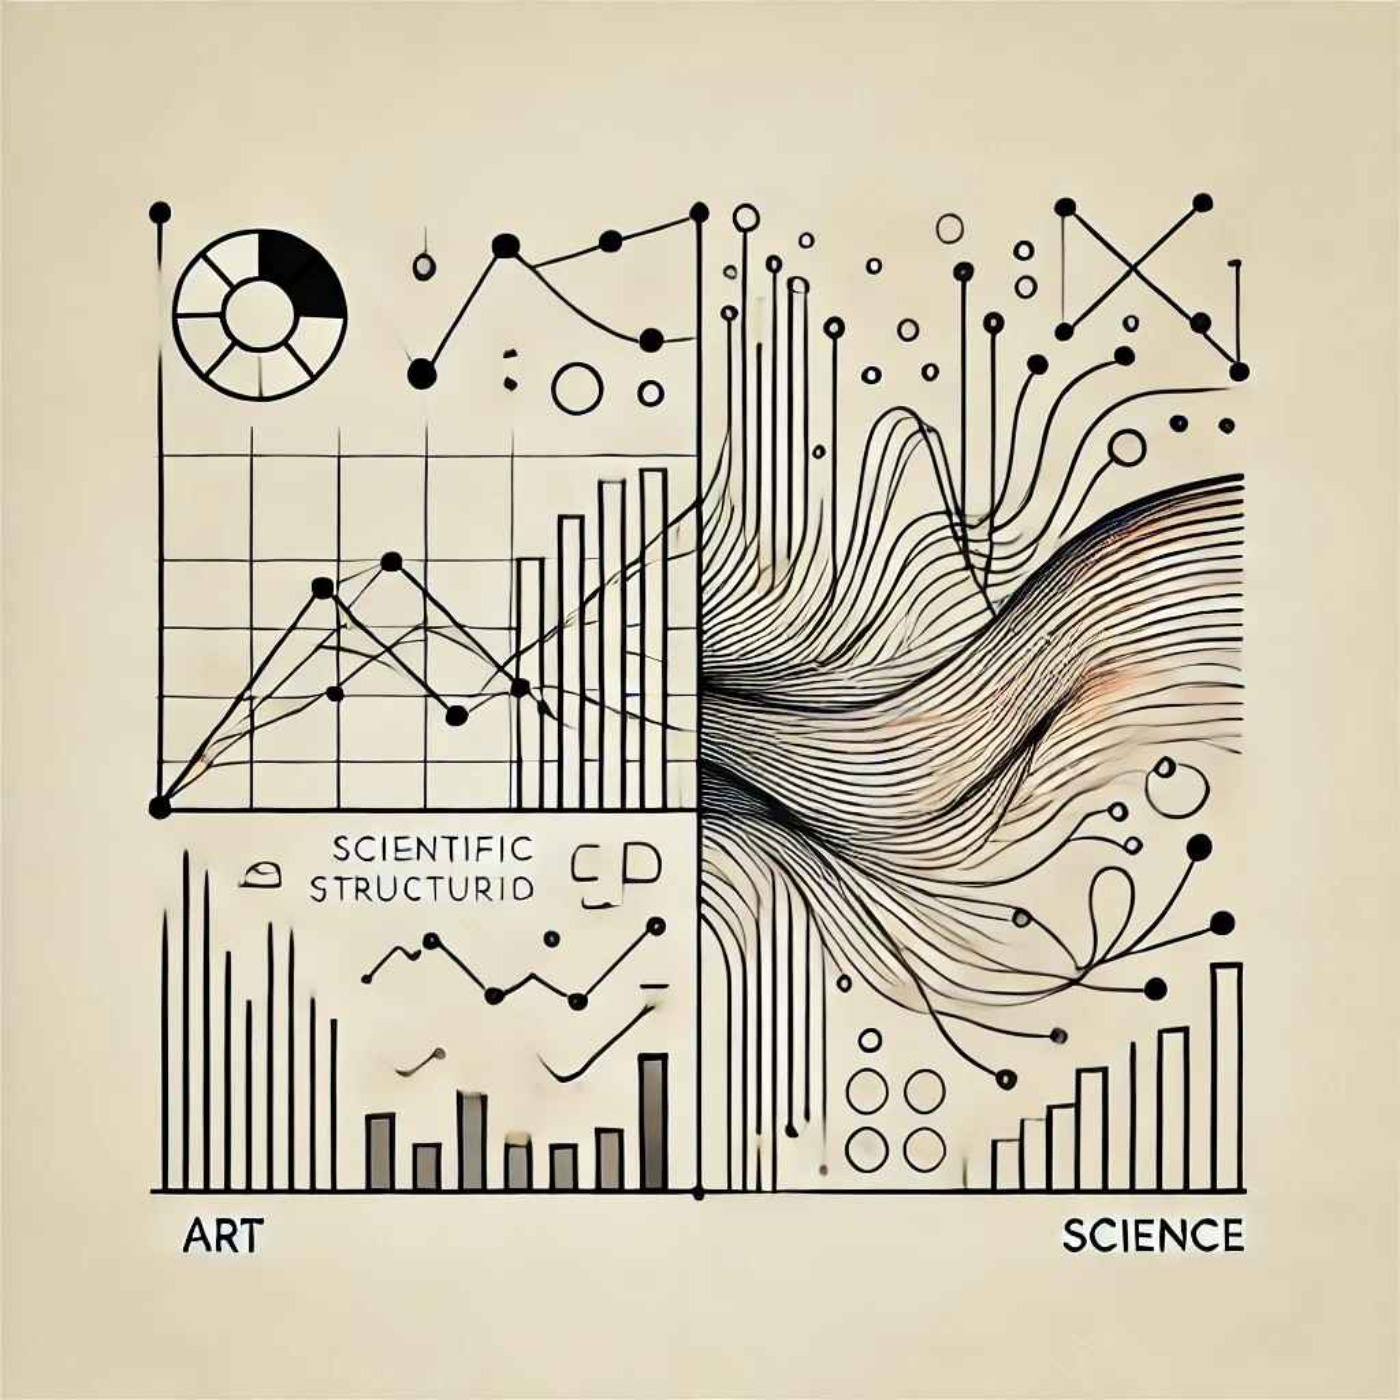
In this episode, we briefly and loosely define Felipe Rego's concept of data visualization as a process that involves art and science with the intent to magnify knowledge for those who consume it. Professionals with a good grasp of data visualization are in high demand and developing the necessary skills in this field is a must. Hosted on Acast. See acast.com/privacy for more information.
Ιστότοπος: youtube.com
