
Chart Tales: Data Visualisation & Storytelling Ideas
Tips for Creating Better-Looking PowerBI Dashboards
· 9 min · Řada 1 Epizoda 3
Poznámky k epizodě
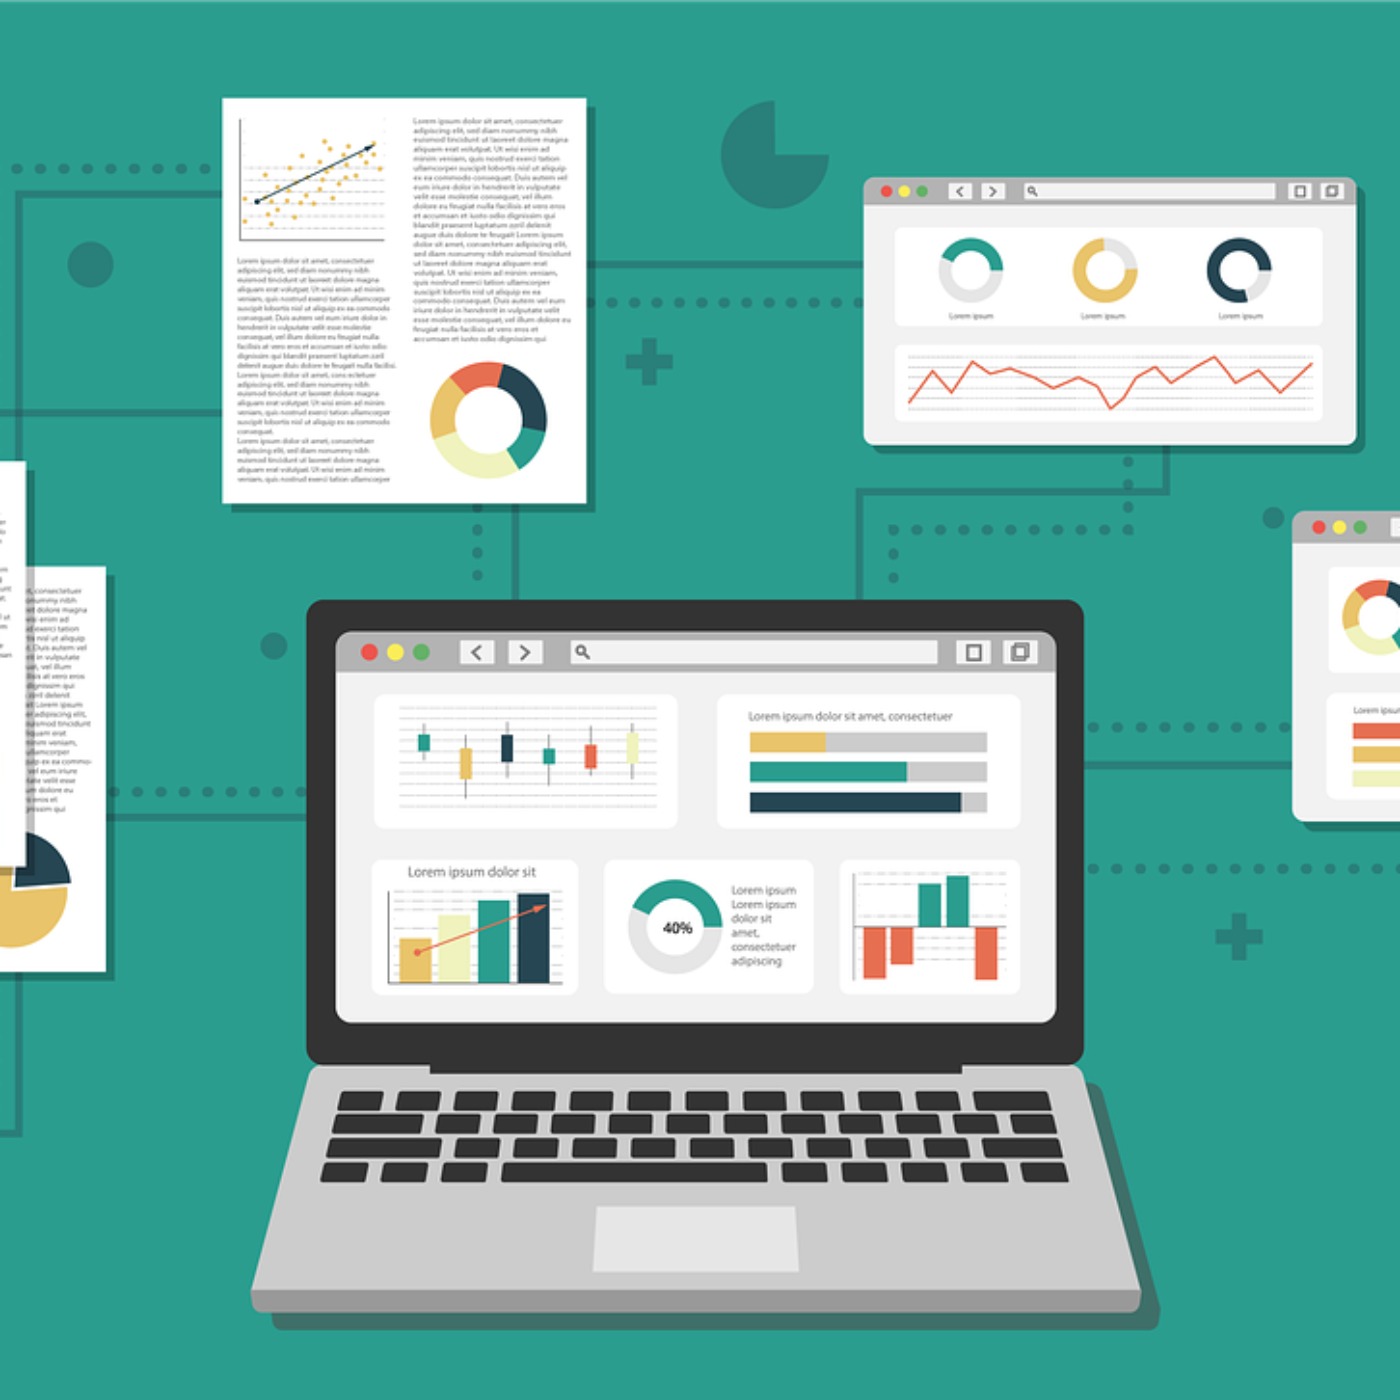
To create better-looking PowerBI dashboards, focus on clarity, simplicity, and interactivity. Start with a plan that clearly defines the dashboard's purpose and audience. Simplify by showcasing only key metrics, using visual hierarchies, and speeding up performance. Customize designs to match branding, and add interactive elements like filters. Lastly, ensure the dashboard tells a clear data-driven story for effective decision-making. Hosted on Acast. See acast.com/privacy for more information.
Web: feliperego.github.io


